Authors: Archana Loganathan1, Prasanth Manohar [2,3], Sebastian Leptihn [1,2,4], Nachimuthu Ramesh
| Article Received: | 28/12/2020 |
| Received: | 31/12/2020 |
| Accepted: | 05/01/2021 |
Context: Bacteriophages are viruses that infect and kill the bacteria. Plaque formation is one of the distinct characteristics of the viruses. During experimentation, phage plaques are formed as a result of bacterial lysis. Each phage produces a morphologically distinct plaque, independent of its host. However, to date, little is known about plaque formation and how it differs among the phages.
Objectives: This study was designed to determine the plaque morphology of staph phage, vB_Sau_vhc4s, against three clinical isolates of Staphylococcus aureus (SA-1, SA-2, SA-3).
Methods: The phage life cycle against the staphylococcal isolates was studied by determining the absorption time, latency period, and burst size with adsorption curve and one-step growth curve experiments. Lifecycle pattern was analyzed for isolates showing varying plaque size with the same phage (vB_Sau_vhc4s). Accordingly, large plaques were formed against SA-1, moderate plaques against SA-2, and tiny plaques against SA-3.
Results: This study showed that the adsor ption time for the isolate SA-1 was 15 min which is delayed adsorp- tion in comparison with the isolates SA-2 and SA-3 which had early adsorption at 5th min. One-step growth curve showed that SA-1 and SA-2 had earlier lysis at 5th min, while SA-3 showed delayed lysis at 10th min. The burst size (phages per infected cell) of SA-1, SA-2, and SA-3 were 102, 101, and 76 respectively
Conclusion: This study concludes that the plaque size or morphology is largely determined by the phage adsorption (to the bacterial cell) and burst size (progeny).
Keywords: Bacteriophage, Phage plaques, Phage lifecycle, Plaque morphology
Bacteriophages, or phages for short, are viruses, which means bacterial eater (“bacterio–bacteria”, “phage–eater”) [1] Plaque formation is one of the distinct features of all the viruses, produced upon infecting the bacteria. A plaque formation is initiated by a virus, therein, results in the cycle of infection of the bacterial host by the progeny viral particles [2]. It is assumed that the size of the plaque is restricted by the number of cycles of infection that occurs within the plaque. The infection cycle ceas- es as the embedded bacteria forms lawn and be- comes unproductive on the agar media [3].
A virulent (follows lytic cycle) bacteriophage produces clear plaques, while temperate (follows lysogenic cycle) phage tends to produce turbid plaques. The difference in plaque morphology is due to the life cycle of phages. Virulent phages tend to have a single cyclic pattern of infection and immediate.
While temperate phages tend to integrate its genome into the host genome thereby, halting the cycle of lysis and allows the bacterial growth, thus forming cloudiness (looks like bulls-eye) within a zone of plaque [4].
The size and morphology of the plaque can vary by the method and condition undertaken during the experiment [5]. Liquid medium tends to have increased bacterial clearance due to enhanced mobility of the phage, thereby, facilitating the bacteria-phage interaction. But solid media restrict the motility of the phages after a stipulated interval of time, thus confining the lysis of the host. A few phages tend to show diffusion in semi-solid media, which tends to increase the plaque size upon prolonged incubation [6,7].
The simplicity of the phage plaque was studied by numerous researchers and many mathematical models have been drawn based on the outcome. The first mathematical model was devised by Koch, in which, he determined the plaque diffu- sion with reversible and irreversible adsorption. At present, many studies have been conducted by Abedon on the theoretical concept of phage plaque [8]. The simple and universal governing factors of the plaque formation as stated by Abedon and co-workers are – 1) rate of phage multiplication, 2) lysis time, and 3) the diffusion of phages [2]. But none of the mathematical models remains accepted by the scientific community as they tend to fall in low agreement with the laboratory findings [9].
A theoretical analysis by Abedon et al. showed that the major factors that govern the plaque formation in phage are, the rate of phage adsorption, time of lysis (latency period), and the number of progeny particles produced during the infection. 10. In contrast with the theoretical models available in the database, the laboratory models by Gallet et al. shown that the large plaques are produced by the phages with a shorter latency period (the time spent by the phage inside the host) [9].
In this study, we have explored the reason behind the varying plaque size produced by three different isolates of Staphylococcus aureus in response to infection by the same phage, vB_Sau_vhc4s. We tested the lifestyle of phage (vB_Sau_vhc4s) by determining the adsorption time and one-step growth curve. By measuring the time of lysis and the number of phage progeny, we were able to construct a laboratory model to outnumber the phage traits that determine the plaque size.
The Staphylococcus aureus isolates, SA-1, SA-2, and SA-3, were collected from the diagnostic center located in Chennai, India. The isolates were characterized by standard microbiological and clinical guidelines, such as Gram staining, biochemical test, screening in selective agar (mannitol salt agar) [11], and VITEK identificaion system. The growth of the bacterial isolates was maintained in BHI (Brain Heart Infusion) broth at 37°C. A log phase (OD = 0.4) bacterial culture was used throughout the study.
The bacteriophages were isolated following phage enrichment technique from the sewage water sample collected from the Vellore district, Tamil Nadu. Briefly, a log phase bacterial culture (SA- 1) was enriched with the water sample for 16-24 hrs. The enriched mixture was centrifuged at 6000 × g for 15 min and filtered through 0.22 μm syringe filter and the presence of phage was confirmed by spot test. The plaque size was further determined by double agar overlay (DAOL) [12, 13].
The isolated bacteriophage was screened for their efficiency to infect other bacterial isolates (SA-2, SA-3) by spot test and DAOL. The isolated bacteriophage named vB_Sau_vhc4s was prepared in dilutions from 101 to 1014 and spotted onto a lawn of bacterial culture (Fig 1). Now, to determine the efficiency of plating (EOP), the phage was plated using the respective isolate by DAOL method and the plaque-forming unit (PFU) was used to calculate the efficiency of the phage to infect the host [13]. The experiments were performed in triplicates and the plaque size was measured after 18 hrs throughout the study.
To determine the rate of adsorption of the phage to their bacterial host, the number of unadsorbed phages was calculated at different time intervals. An adsorption experiment was performed for each isolate (SA-1, SA-2, SA-3) separately using the phage, vB_Sau_vhc4s. Briefly, the log phase bacterial culture was mixed with the phages at an MOI of 0.001 and incubated at 37 ˚C. Aliquot of 200 μL was removed from the interaction tube (tube incubated with bacteria and phage) and diluted in another tube containing SM buffer (4.3 ml) and chloroform (0.5 mL). This mixture was incubated for 30 min at room temperature (RT) and DAOL was performed to evaluate the number of non-adsorbed phages every 5 min for 25 min [14]. The plates were incubated for 18 hrs and the percentage of phage adsorbed was calculated. The point at which ≤ 50% of the phage adsorbed was considered as a significant phage adsorption point.
The latency period and burst size were calculated by a one-step growth experiment. The bacteria and phage (MOI=0.001) were allowed to interact for a prolonged adsorption period (as determined earlier), and the mixture was centrifuged at 12,200 x g for 5 min and the pellet was resus- pended in an equal volume of SM buffer. The aliquot was removed at every 5 min interval and DAOL was performed to determine the latency period and burst size [14, 15]. The plates were incubated for 18 hrs and the number of plaques was counted.
All the experiments were repeated thrice and graphs were plotted using statistical software - GraphPad Prism 7.04. The plaque size was measured and the represented values are mean ± SD.
The isolated phage was assessed for efficiency by DAOL, in which the phage (vB_Sau_vhc4s) showed varying plaque size against the three isolates (SA-1, SA-2, SA-3). The study design involves determining the relationship between plaque size and the phage life cycle. The isolate SA-1 showed a large plaque of 1.5 ± 0.05 mm in size, SA-2 showed moderate plaques of 0.5 ± 0.05 mm, and SA-3 with a tiny plaque of 0.1 ± 0.02 mm (Fig 2). The plaque morphology and plaque size are listed in S. Table 1.
The effect of the phage adsorption on the plaque size was evaluated using the same three isolates (SA-1, SA-2, SA-3) that showed varying plaque size. We were interested to know if the life cycle and the plaque size were interrelated to each oth- er. This was accomplished by a simple set of an experiment that was performed to determine the phage adsorption, latency period, and burst size against the three different isolates that showed different plaque size against the same phage (vB_Sau_vhc4s). In the adsorption experiment, the isolate SA-1 showed a delayed adsorption pattern when compared with the other two isolates. The significant phage adsorption time for SA-1 started at the 15th min and the cycle lasted till the 25th min, with 28% of the phage adsorbed to the host cells at the end of each adsorption cycle. The isolate SA-2 and SA-3 showed early adsorption with the significant phage adsorption time starting at 5th min and the cycle lasted up to 15 min, with 36% and 33% of the phage adsorbed at the end of adsorption cycle. The data and the adsorption curve for all the three isolates are graphically represented in Fig 3.
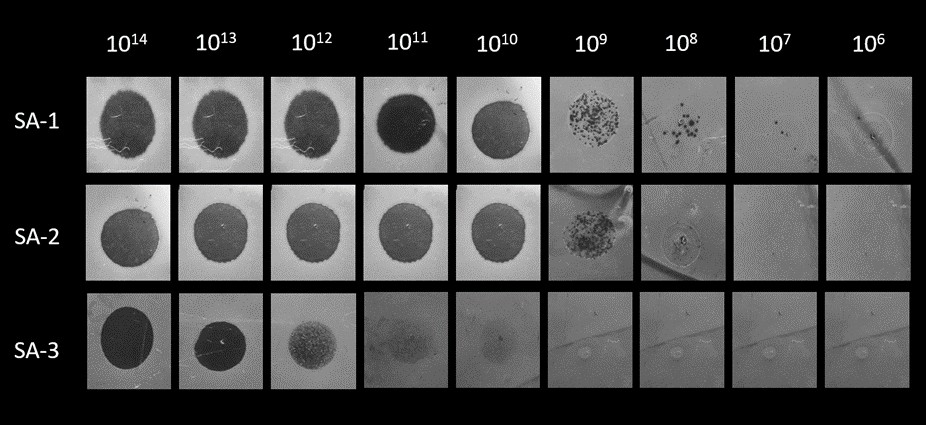
Figure 1: Determination of Efficiency of plating (EOP) for a staph phage, vB_Sau_vhc4s, against the S. aureus isolates, SA-1, SA-2 and SA- 3, using spot test. The values 10[6] – 10[14] represent the phage concentration.
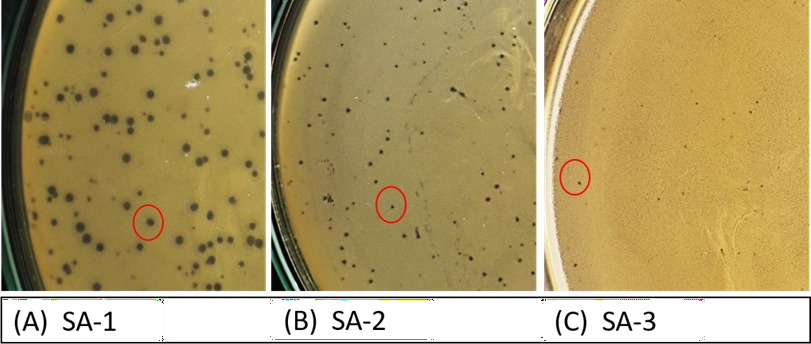
Figure 2: The plaques produced by a staph phage, vB_Sau_vhc4s, on the BHI agar plates using the double agar overlay method. The difference in plaque size produced by a phage vB_Sau_S against three different staphylococcal isolates, A) against isolate SA-1 showing large plaque size, B) against isolate SA-2 showing moderate plaque size, C) against isolate SA-3 showing tiny plaque size.
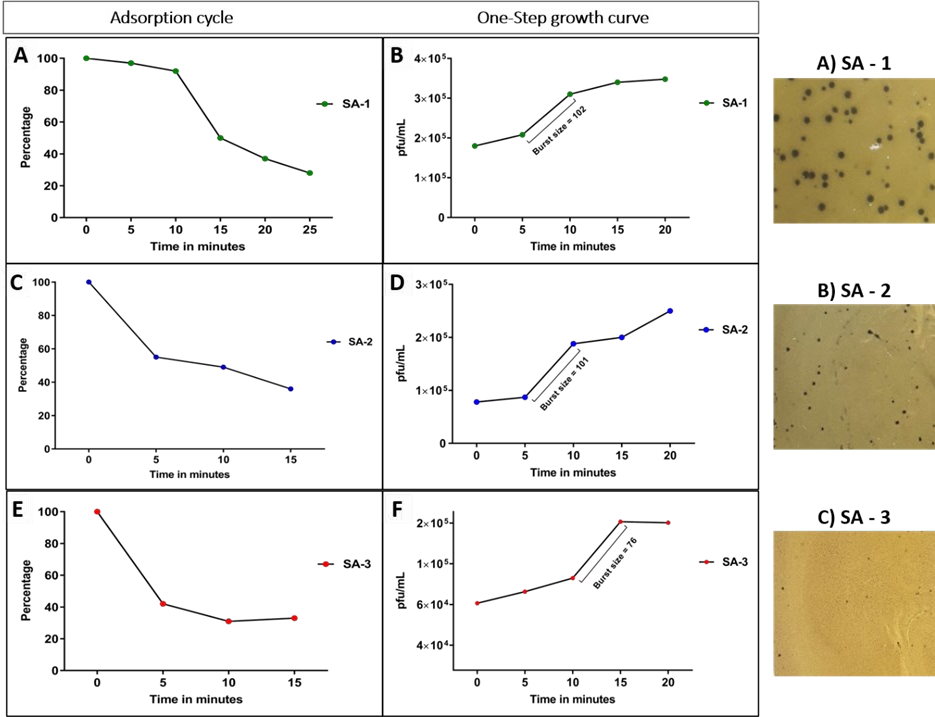
Figure 3: Lifecycle of a staph phage, vB_Sau_vhc4s, against the isolates of Staphylococcus aureus (SA-1, SA-2, SA-3). The graph A, C, and E shows the adsorption time analysis graph. B, D and F shows the one-step growth curve analysis.
The latency period and the burst size were determined by one-step growth curve analysis. The time of lysis and burst size showed a positive correlation with the isolates studied. The lysis time for the isolate SA-1 and SA-2 was found to be 5 min, while SA-3 had lysis at 10 min. The burst size for the isolates SA-1, 2, 3 was found to be 102, 101, and 76 respectively. The data are represented graphically in Fig 3.
Plaque formation is a unique identity of bacteriophages that aid in enumeration against the bacteria. Phage plaques remain the concept of investigation for a long-time and understanding the fundamentals could help in exploring and improving the phage infection during treatment. Our findings have shown that the infectivity of phages differs between the bacterial hosts, thus there is a need for extended evaluation before they are taken for applications.
Plaque is nothing but a tiny area of phage multiplication initiated by a single phage and this zone of clearance is formed as a result of bacterial lysis. Plaque varies among the phages and they are governed by the rate of phage diffusion, bacterial multiplication rate, the nutritional state of the media, phage adsorption rate, and the time of lysis of phage progeny. All of the above factors are interrelated and the lack of any of these factors would result in poor plaque formation affecting both plaque size and morphology [7,16]. The bacterial growth rate is very crucial to determine phage efficiency. Phage multiplica- tion directly coincides with the multiplication rate of bacteria. Multiplication of bacteria is determined by various factors, one significant enhancer being the nutrients and media supplements.
As stated in one of our previous studies, plaque size and morphology is directly influenced by changing the bacteriological media 17. The phages produced different types of plaques on the different bacteriological medium. This eventually showed that bacterial growth condi-
The bacterial growth is always enhanced by supplements such as nutrients [18]. Usually, bacteria tend to grow faster in the nutrient-rich environment5 and it was observed that large plaque was produced when the bacteria had a high growth rate with respect to phage multiplication [10, 19]. This eventually questions the potential of phages to multiply inside the human system. Therefore, knowing the bacterial growth might be fundamental in determining the phage plaque size and other factors concerning bacterial clearance.
A study conducted by Gallet et al. falls in correlation with our results. The isogenic strain used in the study showed delayed adsorption time and resulted in a small plaque size than a large plaque with earli- er adsorption. [9]
Numerous factors could concern the plaque size. As the phage life cycle completely relies on the bacterial growth rate, thus the phage life cycle is completely controlled by bacteria. This also shows that phage trait is directly propor- tional to bacterial growth conditions. The nature of this bac- terial growth parameter is supported by a mathematical model by Golec et al. that showed that the growth rate of bacteria directly influences the phage multiplication parameters [20].
Our study showed that the adsorption time, latency period and burst size of the isolates varied and that resulted in varying plaque sizes. All these three factors are interrelated with each other and need to be optimal to produce a larger plaque. Adsorption time is a primary parameter for phage.
Our results showed that the optimal adsorption rate was needed for the maximal plaque size; too early or too delayed adsorption would result in diminished (size) plaques. The isolate SA-1 showed a moderate adsorption time when compared to SA-2 and SA-3. The adsorption time and latency period of SA-1, SA-2, SA-3 were 15 and 5 min, 5 and 5 min, and 5 and 10 min respectively, and their respective plaque size was as large, moderate and tiny.
Time of lysis is one of the important parameters for determining the phage plaque size and the multiplication rate. The number of infection cycles within a plaque is directly proportional to plaque size. A phage can undergo an active infection cycle during the productive stage of the bacteria. As the time of lysis tends to be shorter, the number of lysis cycle would be more. This provides more chance for the phage to evade the surrounding bacteria before the bacteria enter the unproductive phase 21. The burst size is another parameter for the determination of phage plaque size and is found to have a positive impact on the plaque size. The burst size for the isolate SA-1, SA-2, and SA-3 are 102, 101, and 76 respectively. The decreased burst size of the isolate SA-3 (76) has decreased the plaque size, producing tiny plaques. This proves that the burst size does have much significance in enhancing the plaque size. In this study, we investigated the phage life cycle and plaque size co-relationship using three S. aureus isolates. The results elucidated that plaque size is more or less dependent on bacterial multiplication. In the laboratory experiments, the major parameters that could affect the phage multiplication and plaque size were phage adsorption rate and lysis time. We also concluded that burst size is one of the important factors to determine the plaque infectious rate. Despite the phage showing a broad-host-range, there is a need for assessing the phage life cycle for successful phage characterization2. This study concludes that plaque size can vary between the bacteria (at genus or species or strain level) and are largely dependent on the phage adsorption rate and time of lysis.
The investigations from this study concluded that the phage life cycle and bacterial growth rate directly influences the plaque morphology and size. We also found that optimal adsorption time and lysis time was more critical for enhanced plaque size. The burst size could affect the plaque size, with low progeny producers forming small or tiny plaques and high progeny producers forming large plaques. Though there are numerous methods and models available for predicting the phage morphology, the insights on their exact mecha- nism need to be validated with various phage groups and strains. Thus, this study has laid a foundation on the fundamental theory on the interrelationship between the phage life cycle and plaque morphology in S. aureus, which will serve as a baseline for future investigations.
The authors would like to thank Vellore Institute of Technology for supporting our research in the form of ‘SEED Grant’.
SEED Grant, VIT, Vellore
The authors declare that there is no conflict of interest.
1. Pirnay J-P, Verbeken G, Ceyssens P-J, Huys I, De Vos D, Ameloot C, et al. The Magistral Phage. MDPI 2018;10:64.
2. Abedon ST, Culler RR. Optimizing bacteriophage plaque fecundity. J Theor Biol. 2007;249:582–92.
3. Krone SM. Modeling phage plaque growth. Bacteri phage Ecol 2009;415–38.
4. Payet JP, Suttle CA. To kill or not to kill: The balance between lytic and lysogenic viral infection is driven by trophic status. Limnol Oceanogr 2013;58:465–74.
5. Ramesh N, Archana L, Royam M, Eniyan K. Effect of various bacteriological media on the plaque morphol gy of Staphylococcus and Vibrio phages. Access Microbiol. 2019;1.
6. Mitarai N, Brown S, Sneppen K. Population dynamics of phage and bacteria in spatially structured habitats using phage λ and Escherichia coli. J Bacteriol. 2016;198:1783–93.
7. Krysiak-Baltyn K, Martin GJO, Stickland AD, Scales PJ, Gras SL. Computational models of populations of bacteria and lytic phage. Crit. Rev. Microbiol. 2016;942–68.
8. Abedon ST. Detection of Bacteriophages: Phage Plaques. Bacteriophages. 2018.
9. Gallet R, Kannoly S, Wang IN. Effects of bacteriophage traits on plaque formation. BMC Microbiol. 2011;11:181.
10. Abedon ST, Yin J. Bacteriophage plaques : Theory and analysis. Bacteriophages Methods Protocol 2009;501:161–75.
11. Loganathan A, Manohar P, Eniyan K, Jayaraj R, N chimuthu R. Evaluation of various phenotypic methods with genotypic screening for detection of methicillin resistant Staphylococcus aureus. 2019;13:225–33.
12. Clokie MRJ, Kropinski AM. Bacteriophages : Methods and protocols, Volume 1 - Isolation, Characterization, and Interactions. Methods Mol. Biol. 2009.
13. Manohar P, Tamhankar AJ, Lundborg CS, Ramesh N. Isolation, characterization and in vivo efficacy of Escherich-ia phage myPSH1131. 2018;13
14. Manohar P, Tamhankar AJ, Lundborg CS, Nachimuthu R. Therapeutic Characterization and Efficacy of Bacteriophage Cocktails Infecting Escherichia coli, Klebsiella pneu- moniae, and Enterobacter Species. Front Microbiol. 2019;10.
15. Tobias Jenkins AA. Combined use of bacteriophage K and a novel bacteriophage to reduce Staphylococcus aureus biofilm. Applied and Environmental Microbiology 2014;80: 6694-6703.
16. García R, Latz S, Romero J, Higuera G, García K, Bastías R. Bacteriophage production models: An overview. Front. Microbiol. 2019. 1–7.
17. Ramesh N, Archana L, Madurantakam Royam M, Ma- nohar P, Eniyan K. Effect of various bacteriological media on the plaque morphology of Staphylococcus and Vibrio phages. Access Microbiol. 2019;1:1–4.
18. Hadas H, Einav M, Fishov I, Zaritsky A. Bacteriophage T4 development depends on the physiology of its host Escherichia coli. Microbiology . Microbiology Society; 1997;143:179–85.
19. Nabergoj D, Modic P, Podgornik A. Effect of bacterial growth rate on bacteriophage population growth rate. Microbiologyopen. 2018;7
20. Golec P, Karczewska-Golec J, Loś M, Wegrzyn G. Bacteriophage T4 can produce progeny virions in extremely slowly growing Escherichia coli host: Comparison of a mathematical model with the experimental data. FEMS Microbiol Lett. 2014;351: 156-161
21. Koch AL. The growth of viral plaques during the enlargement phase. J Theor Biol. 1964;6:413–31.
Archana L, Prasanth M, Sebastian L, Nachimuthu R. Effect of phage lifestyle on the plaque morphoogy. Int J Bacteriophage Res 2021:1:10-5.